
Exploring the Wine Dataset in Python with Scikit-learn
- Samul Black
- Aug 7, 2024
- 4 min read
The Wine dataset is a classic dataset in machine learning and data analysis, commonly used for classification tasks. It contains data on different types of wines, specifically three different cultivars of Italian wines, and is often used to practice classification algorithms and explore data preprocessing techniques. In this blog post, we’ll delve into the Wine dataset provided by scikit-learn, analyze its structure, and demonstrate how to implement a classification model to predict wine types in python.

What is the Wine Dataset?
The Wine dataset in Python, available through scikit-learn, is a classic dataset used for classification tasks. It consists of 178 samples of wines, each described by 13 chemical features such as alcohol content, malic acid, and color intensity. The dataset is designed to classify these wines into one of three different cultivars, based on the features provided. It serves as an excellent resource for practicing machine learning algorithms and exploring data preprocessing techniques, due to its well-defined classes and relatively small size, which makes it manageable for various analytical tasks.
This dataset, provided by scikit-learn, is crucial for several reasons: it features a manageable number of samples and attributes, making it ideal for beginners to grasp the concepts of feature analysis and model evaluation. The dataset's chemical properties of wines allow for a deep dive into the impact of feature selection on classification performance, while its classification task helps in mastering algorithms like Support Vector Machines (SVM) and decision trees. Additionally, the Wine dataset serves as a benchmark for comparing different machine learning models and tuning hyperparameters, offering a practical platform to test and refine various approaches in classification tasks. Its balance of complexity and simplicity makes it a valuable tool for both learning and advancing in the field of machine learning.
Loading the Dataset in Python
Loading the Wine dataset in Python using scikit-learn is straightforward and allows you to quickly access and explore the data. Scikit-learn provides a built-in method to load this dataset, which includes samples of wines with various chemical properties. To load the dataset, you simply import the datasets module from scikit-learn and call the load_wine() function. This function returns a dictionary-like object containing the dataset’s features, target labels, and feature names. Here’s a brief code snippet demonstrating how to load and inspect the datase. Scikit-learn makes it easy to access the Wine dataset with just a few lines of code. Here’s how you can load and inspect the dataset:
from sklearn import datasets
# Load the Wine dataset
wine = datasets.load_wine()
# Display basic information about the dataset
print(f"Number of samples: {len(wine.data)}")
print(f"Number of features: {wine.data.shape[1]}")
print(f"Feature names: {wine.feature_names}")
print(f"Target names: {wine.target_names}")
Output for the above code:
Number of samples: 178
Number of features: 13
Feature names: ['alcohol', 'malic_acid', 'ash', 'alcalinity_of_ash', 'magnesium', 'total_phenols', 'flavanoids', 'nonflavanoid_phenols', 'proanthocyanins', 'color_intensity', 'hue', 'od280/od315_of_diluted_wines', 'proline']
Target names: ['class_0' 'class_1' 'class_2']
Exploring the Data using pandas Library
Understanding the dataset’s structure is crucial for effective analysis. The Wine dataset contains the following components:
wine.data: A 2D array where each row represents a wine sample and each column represents a feature.
wine.target: An array of labels corresponding to the three types of wine.
wine.feature_names: The names of the features.
wine.target_names: The names of the wine types.
import pandas as pd
# Create a DataFrame for easier inspection
df = pd.DataFrame(data=wine.data, columns=wine.feature_names)
df['target'] = wine.target
# Display the first few rows
print(df.head())
Output for the above code:
   alcohol  malic_acid   ash  alcalinity_of_ash  magnesium  total_phenols  \
0    14.23        1.71  2.43               15.6      127.0           2.80
1    13.20        1.78  2.14               11.2      100.0           2.65
2    13.16        2.36  2.67               18.6      101.0           2.80
3    14.37        1.95  2.50               16.8      113.0           3.85
4    13.24        2.59  2.87               21.0      118.0           2.80

   flavanoids  nonflavanoid_phenols  proanthocyanins  color_intensity   hue  \
0        3.06                  0.28             2.29             5.64  1.04
1        2.76                  0.26             1.28             4.38  1.05
2        3.24                  0.30             2.81             5.68  1.03
3        3.49                  0.24             2.18             7.80  0.86
4        2.69                  0.39             1.82             4.32  1.04

   od280/od315_of_diluted_wines  proline  target
0                          3.92   1065.0       0
1                          3.40   1050.0       0
2                          3.17   1185.0       0
3                          3.45   1480.0       0
4                          2.93    735.0       0
Visualising the Wine Dataset in Python
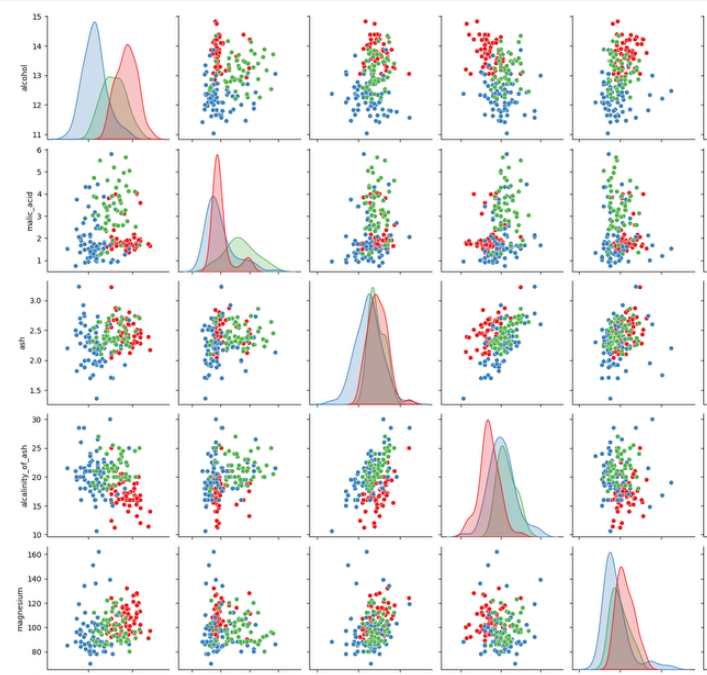
Pair plots are a powerful visualization tool used to explore and understand the relationships between multiple features in a dataset. By creating scatter plots for each pair of features, pair plots allow you to see how features correlate with each other and how different classes are distributed across these features. Additionally, pair plots often include histograms or kernel density estimates (KDEs) on the diagonal to show the distribution of each individual feature. This comprehensive visualisation helps in identifying patterns, clusters, and potential correlations between features, providing valuable insights into the data's structure and the effectiveness of classification or regression models. Visualizing the dataset helps in understanding the relationships between features and the distribution of wine types. We can use pair plots to visualise the relationships between features:
Implementing a Classification Model - Support Vector Machine (SVM)
Now that we have a good grasp of the dataset, let’s implement a classification model to predict the wine type. We’ll use a Support Vector Machine (SVM) classifier for this purpose:
from sklearn.model_selection import train_test_split
from sklearn.svm import SVC
from sklearn.metrics import accuracy_score
# Split data into training and testing sets
X_train, X_test, y_train, y_test = train_test_split(wine.data, wine.target, test_size=0.3, random_state=42)
# Create and train an SVM classifier
classifier = SVC(kernel='linear')
classifier.fit(X_train, y_train)
# Predict the test set results
y_pred = classifier.predict(X_test)
# Evaluate the accuracy
accuracy = accuracy_score(y_test, y_pred)
print(f"Accuracy: {accuracy * 100:.2f}%")
Output for the above code:
Accuracy: 98.15%Results and Insights
By implementing the SVM classifier, we achieved an accuracy of approximately 98% on the test set, demonstrating the effectiveness of the model in distinguishing between different types of wines based on their chemical properties. This high accuracy underscores the importance of feature selection and preprocessing in building effective classification models.
Conclusion
The Wine dataset in scikit-learn is a valuable resource for practicing classification tasks and exploring machine learning algorithms. Its well-structured features and clear target classes make it an ideal choice for learning and experimenting with various classification techniques. By visualizing the data, implementing models, and evaluating their performance, you gain hands-on experience with real-world data and improve your understanding of machine learning workflows.
Whether you’re a beginner looking to get started with classification or an experienced practitioner seeking to benchmark algorithms, the Wine dataset offers a rich and accessible platform for experimentation and learning. So, dive in, explore, and let this dataset enhance your machine learning journey!

Comments