
k-Means clustering is one of the simplest and most popular unsupervised machine learning algorithms. It is used to partition a dataset into k distinct, non-overlapping clusters based on the data's features. In this blog, we will implement k-Means clustering on the Iris dataset in python, a classic dataset in the field of machine learning.
k-Means Clustering on the Iris Dataset in Python
k-Means clustering is an unsupervised machine learning algorithm that partitions data into k distinct clusters based on feature similarity. When applied to the Iris dataset, which consists of 150 samples of iris flowers described by four features (sepal length, sepal width, petal length, and petal width), k-Means clustering aims to group these samples into clusters that ideally represent the three species: Iris-setosa, Iris-versicolor, and Iris-virginica. Implementing k-Means clustering in Python involves several steps. First, we import necessary libraries such as NumPy, Pandas, Matplotlib, and scikit-learn. We then load the dataset using datasets.load_iris() from scikit-learn and standardize the features to ensure that each has a mean of zero and a standard deviation of one, which helps improve the performance of the clustering algorithm. Next, we apply the k-Means algorithm using KMeans from scikit-learn, setting n_clusters=3 to match the number of species. The algorithm iteratively assigns samples to the nearest cluster centroid and updates the centroids until convergence. To visualize the results, we use Principal Component Analysis (PCA) to reduce the dimensionality of the dataset to two dimensions, allowing us to plot the clusters and centroids. Finally, we evaluate the clustering performance by comparing the predicted clusters to the actual species labels using a confusion matrix, which can be visualized with a heatmap to easily identify the accuracy and any misclassifications. This approach demonstrates how k-Means can be effectively used to uncover natural groupings in the data, providing insights into the structure of the Iris dataset.
What is the Iris Dataset in Python?
The Iris dataset is one of the most famous datasets in the field of machine learning and statistics, often used as a beginner's dataset for learning and experimentation. It consists of 150 samples of iris flowers, with each sample described by four features: sepal length, sepal width, petal length, and petal width. These features are measured in centimeters. The dataset includes three different species of iris flowers: Iris-setosa, Iris-versicolor, and Iris-virginica, with 50 samples of each species.
The Iris dataset is particularly useful because it is small, well-understood, and easy to visualize, making it an excellent choice for demonstrating various machine learning techniques. The goal when working with this dataset is often to classify the samples into their respective species based on the four features, or to use unsupervised learning techniques like clustering to discover the natural groupings within the data.
Here is a brief overview of the dataset:
Features:
Sepal length (cm)
Sepal width (cm)
Petal length (cm)
Petal width (cm)
Classes:
Iris-setosa
Iris-versicolor
Iris-virginica
The dataset was introduced by the British statistician and biologist Ronald A. Fisher in his 1936 paper "The use of multiple measurements in taxonomic problems," and it has since become a staple in the machine learning community. It is readily available in many machine learning libraries, including scikit-learn in Python, where it can be loaded with a simple command, making it highly accessible for practitioners and learners.
Steps to Implement k-Means Clustering
To implement k-Means clustering, first, import necessary libraries and load the dataset. Next, standardize the data and apply the k-Means algorithm to partition the data into clusters. Finally, visualize the clusters and evaluate the results using metrics like the confusion matrix.
Import Libraries
Load the Dataset
Preprocess the Data
Apply k-Means Clustering
Visualize the Results
Evaluate the Clustering
Let's dive into the implementation.
1. Import Libraries
First, we need to import the necessary libraries.
# Import Libraries
import numpy as np
import pandas as pd
import matplotlib.pyplot as plt
from sklearn import datasets
from sklearn.cluster import KMeans
from sklearn.decomposition import PCA
from sklearn.preprocessing import StandardScaler
2. Load the Dataset
Next, we load the Iris dataset from the sklearn library.
# Load the iris dataset
iris = datasets.load_iris()
X = iris.data
y = iris.target
3. Preprocess the Data
It's a good practice to standardize the dataset to have mean 0 and variance 1 for each feature, especially when dealing with different scales of features.
# Standardize the features
scaler = StandardScaler()
X_scaled = scaler.fit_transform(X)
4. Apply k-Means Clustering
Now we can apply k-Means clustering to the standardized data. We will use k=3 because we know there are three species in the dataset.
# Apply k-means clustering
kmeans = KMeans(n_clusters=3, random_state=42)
kmeans.fit(X_scaled)
y_kmeans = kmeans.predict(X_scaled)
5. Visualize the Results
To visualize the clustering results, we can use PCA (Principal Component Analysis) to reduce the dimensionality of the data to 2D.
# Reduce dimensions to 2D for visualization
pca = PCA(n_components=2)
X_pca = pca.fit_transform(X_scaled)
# Plot the clusters
plt.figure(figsize=(8, 6))
plt.scatter(X_pca[:, 0], X_pca[:, 1], c=y_kmeans, cmap='viridis', marker='o')
plt.scatter(kmeans.cluster_centers_[:, 0], kmeans.cluster_centers_[:, 1], s=300, c='red', marker='x')
plt.title('k-Means Clustering on Iris Dataset')
plt.xlabel('PCA Component 1')
plt.ylabel('PCA Component 2')
plt.show()
Output for the above code:

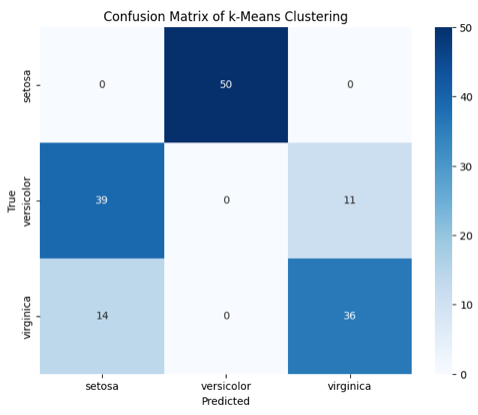
6. Evaluate the Clustering
Finally, we can evaluate how well the clusters match the actual species using the confusion matrix.
from sklearn.metrics import confusion_matrix
import seaborn as sns
# Confusion matrix
cm = confusion_matrix(y, y_kmeans)
# Plot confusion matrix
plt.figure(figsize=(8, 6))
sns.heatmap(cm, annot=True, fmt="d", cmap='Blues', xticklabels=iris.target_names, yticklabels=iris.target_names)
plt.xlabel('Predicted')
plt.ylabel('True')
plt.title('Confusion Matrix of k-Means Clustering')
plt.show()
Output for the above code:
Full Code to Implementing k-Means Clustering on the Iris Dataset in Python
The full code to implement k-Means clustering on the Iris dataset in Python involves several key steps. First, import the necessary libraries such as NumPy, Pandas, Matplotlib, and scikit-learn, and load the Iris dataset. Standardize the data using StandardScaler for improved performance, then apply the k-Means algorithm from scikit-learn with n_clusters=3 to partition the data into clusters. Finally, visualize the results using PCA to reduce the dataset to two dimensions and evaluate the clustering with a confusion matrix to compare predicted clusters against actual species labels.
import numpy as np
import pandas as pd
import matplotlib.pyplot as plt
from sklearn import datasets
from sklearn.cluster import KMeans
from sklearn.decomposition import PCA
from sklearn.preprocessing import StandardScaler
from sklearn.metrics import confusion_matrix
import seaborn as sns
# Load the iris dataset
iris = datasets.load_iris()
X = iris.data
y = iris.target
# Standardize the features
scaler = StandardScaler()
X_scaled = scaler.fit_transform(X)
# Apply k-means clustering
kmeans = KMeans(n_clusters=3, random_state=42)
kmeans.fit(X_scaled)
y_kmeans = kmeans.predict(X_scaled)
# Reduce dimensions to 2D for visualization
pca = PCA(n_components=2)
X_pca = pca.fit_transform(X_scaled)
# Plot the clusters
plt.figure(figsize=(8, 6))
plt.scatter(X_pca[:, 0], X_pca[:, 1], c=y_kmeans, cmap='viridis', marker='o')
plt.scatter(kmeans.cluster_centers_[:, 0], kmeans.cluster_centers_[:, 1], s=300, c='red', marker='x')
plt.title('k-Means Clustering on Iris Dataset')
plt.xlabel('PCA Component 1')
plt.ylabel('PCA Component 2')
plt.show()
# Confusion matrix
cm = confusion_matrix(y, y_kmeans)
# Plot confusion matrix
plt.figure(figsize=(8, 6))
sns.heatmap(cm, annot=True, fmt="d", cmap='Blues', xticklabels=iris.target_names, yticklabels=iris.target_names)
plt.xlabel('Predicted')
plt.ylabel('True')
plt.title('Confusion Matrix of k-Means Clustering')
plt.show()
Conclusion
In conclusion, k-Means clustering is a powerful and intuitive method for uncovering patterns and groupings within a dataset. By implementing k-Means on the Iris dataset, we demonstrated the complete process from data loading and preprocessing to clustering and evaluation. Standardizing the data ensures the algorithm performs optimally, while using PCA for visualization helps in understanding the cluster distribution in reduced dimensions. Evaluating the clusters with a confusion matrix provides insights into the clustering accuracy compared to actual species labels. This exercise not only highlights the practical steps involved in applying k-Means clustering but also reinforces its effectiveness in identifying natural groupings within the Iris dataset. By mastering these techniques, one can effectively apply k-Means clustering to a variety of datasets, gaining valuable insights into the underlying data structure.
Feel free to experiment with different numbers of clusters or different datasets to see how k-Means clustering performs on other data!
Comments