
Principal Component Analysis (PCA) is a powerful technique in data science and machine learning for dimensionality reduction. It helps in simplifying complex datasets while retaining their essential features. This blog will guide you through PCA, how it works, and how to implement it in Python using popular libraries like Scikit-learn and NumPy.

What is Principal Component Analysis (PCA) in Python?
Principal Component Analysis (PCA) in Python is a powerful technique used for dimensionality reduction in data analysis and machine learning. PCA transforms a dataset with potentially many correlated features into a smaller set of linearly uncorrelated variables known as principal components. These components capture the most variance in the data, effectively simplifying the dataset while retaining its most critical information. In Python, PCA is commonly implemented using libraries such as Scikit-learn, which provides straightforward tools to standardize the data, compute covariance matrices, extract eigenvalues and eigenvectors, and project the data onto a new feature space. This technique is invaluable for reducing computational complexity, improving model performance, and enabling clearer data visualization. PCA is a statistical procedure that transforms a set of correlated variables into a set of linearly uncorrelated variables called principal components. These components are ordered by the amount of variance they capture from the data. Essentially, PCA helps in:
Reducing Dimensionality: By projecting data into a lower-dimensional space, PCA can help reduce computational costs and make data easier to visualize.
Removing Redundancy: It removes correlated features and keeps only the most informative ones.
Noise Reduction: PCA can help in reducing the noise by focusing on the most significant features.
How Principal Component Analysis (PCA) Works
Principal Component Analysis (PCA) works by identifying the directions (principal components) in which the data varies the most and projecting the data onto these directions to reduce its dimensionality. The process begins with standardizing the data, which involves centering the data by subtracting the mean and scaling it to unit variance. Next, PCA computes the covariance matrix to capture the relationships between features. Eigenvalues and eigenvectors are then derived from this covariance matrix; eigenvectors represent the directions of maximum variance, while eigenvalues indicate the magnitude of variance in those directions. The eigenvectors are sorted by their eigenvalues, and the top kk eigenvectors form the new feature space. By projecting the original data onto these top components, PCA reduces its dimensionality while preserving the most significant patterns and relationships in the data.
Standardize the Data: PCA requires that the data be centered and scaled. This means subtracting the mean of each feature and dividing by its standard deviation.
Compute the Covariance Matrix: The covariance matrix expresses the variance and covariance between different features.
Calculate Eigenvalues and Eigenvectors: Eigenvectors represent the directions of the new feature space, and eigenvalues represent their magnitude.
Sort and Select Principal Components: The eigenvectors are sorted by their corresponding eigenvalues. The top kk eigenvectors form the new feature space.
Transform the Data: Project the original data onto the new feature space formed by the top kk eigenvectors.
Implementing Principal Component Analysis (PCA) in Python
Implementing Principal Component Analysis (PCA) in Python typically involves using the Scikit-learn library, which simplifies the process. First, you standardize the dataset using StandardScaler, then apply PCA with PCA from Scikit-learn to extract the principal components. Finally, transform the data to the new feature space and analyze the explained variance to understand the data’s structure. Let's walk through a basic example using Python with the help of Scikit-learn and NumPy.
Step 1: Import Libraries
# import necessary libraries
import numpy as np
from sklearn.decomposition import PCA
from sklearn.preprocessing import StandardScaler
from sklearn.datasets import load_iris
import matplotlib.pyplot as plt
Step 2: Load and Prepare Data
We'll use the Iris dataset, which is a classic dataset in machine learning.
# Load dataset
data = load_iris()
X = data.data
y = data.target
# Standardize the data
scaler = StandardScaler()
X_scaled = scaler.fit_transform(X)
Step 3: Apply Principal Component Analysis (PCA)
# Initialize PCA
pca = PCA(n_components=2)
# Fit and transform the data
X_pca = pca.fit_transform(X_scaled)
# Print explained variance ratio
print(f"Explained variance ratio: {pca.explained_variance_ratio_}")
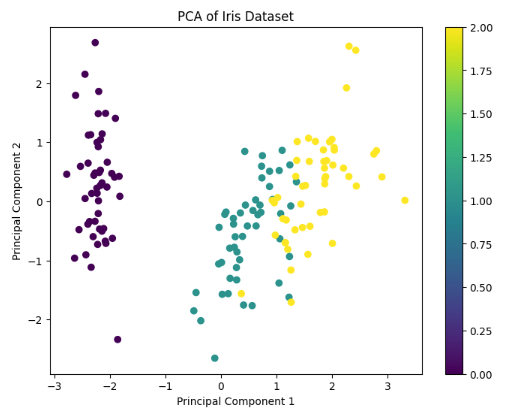
Step 4: Visualize the Results
# Create a scatter plot
plt.figure(figsize=(8, 6))
scatter = plt.scatter(X_pca[:, 0], X_pca[:, 1], c=y, cmap='viridis')
plt.colorbar(scatter)
plt.xlabel('Principal Component 1')
plt.ylabel('Principal Component 2')
plt.title('PCA of Iris Dataset')
plt.show()
Output for the above code:
Full Code for Principal Component Analysis (PCA) in Python
The full code for Principal Component Analysis (PCA) in Python begins by importing essential libraries such as NumPy, Scikit-learn, and Matplotlib. The code then loads and standardizes the dataset to ensure that all features contribute equally to the analysis. PCA is applied using Scikit-learn’s PCA class to reduce the dimensionality of the data while retaining the most significant variance. The principal components are extracted and transformed, and the explained variance ratio is printed to evaluate the amount of variance captured by each component. Finally, a scatter plot visualizes the transformed data in the reduced-dimensional space, providing insights into the structure and separation of the dataset.
# import necessary libraries
import numpy as np
from sklearn.decomposition import PCA
from sklearn.preprocessing import StandardScaler
from sklearn.datasets import load_iris
import matplotlib.pyplot as plt
# Load dataset
data = load_iris()
X = data.data
y = data.target
# Standardize the data
scaler = StandardScaler()
X_scaled = scaler.fit_transform(X)
# Initialize PCA
pca = PCA(n_components=2)
# Fit and transform the data
X_pca = pca.fit_transform(X_scaled)
# Print explained variance ratio
print(f"Explained variance ratio: {pca.explained_variance_ratio_}")
# Create a scatter plot
plt.figure(figsize=(8, 6))
scatter = plt.scatter(X_pca[:, 0], X_pca[:, 1], c=y, cmap='viridis')
plt.colorbar(scatter)
plt.xlabel('Principal Component 1')
plt.ylabel('Principal Component 2')
plt.title('PCA of Iris Dataset')
plt.show()
Conclusion
In conclusion, Principal Component Analysis (PCA) is a crucial technique for dimensionality reduction and data visualization in Python. By transforming a high-dimensional dataset into a lower-dimensional space while retaining its essential variance, PCA simplifies data analysis and enhances model performance. The process involves standardizing the data, computing covariance matrices, and projecting data onto principal components derived from eigenvalues and eigenvectors. Implementing PCA with Python's Scikit-learn library streamlines these steps, making it accessible and efficient. Understanding and applying PCA can lead to more interpretable data, reduced computational costs, and improved insights into complex datasets, paving the way for more effective data analysis and machine learning models.
Comments