
Machine learning has revolutionized the way we approach problems in various fields, from healthcare to finance, and from natural language processing to computer vision. At the heart of this revolution are powerful algorithms that enable machines to learn from data and make intelligent decisions. In this blog, we'll explore five of the most popular and widely used machine learning algorithms, explaining how they work, their key features, and their typical applications.

What are Machine Learning Algorithms?
Machine learning algorithms are the core tools that enable computers to learn from data and make predictions or decisions without being explicitly programmed. These algorithms can be broadly categorized into supervised, unsupervised, and reinforcement learning. Supervised learning algorithms, such as Linear Regression and Support Vector Machines, use labeled data to learn a mapping from inputs to outputs, making them ideal for tasks like classification and regression. Unsupervised learning algorithms, like k-Means Clustering, identify patterns or groupings in unlabeled data, helping in data exploration and dimensionality reduction. Reinforcement learning algorithms, such as Q-learning, enable agents to learn optimal actions through trial and error in an environment, often used in robotics and game playing. Each type of algorithm has its own strengths and is suited to different types of problems, making the selection of the appropriate algorithm a critical step in the machine learning process. Few of the most commonly used ML algorithms are listed below:
1. Linear Regression
Linear regression is a fundamental machine learning algorithm used to model the relationship between a dependent variable and one or more independent variables. It works by fitting a straight line, known as the regression line, through the data points, which best predicts the dependent variable based on the independent variables. This line is determined by minimizing the sum of the squared differences between the observed and predicted values, a method known as Ordinary Least Squares (OLS). Linear regression is widely valued for its simplicity and interpretability, as it provides clear insights into how changes in the independent variables affect the dependent variable. It is particularly useful in situations where the relationship between variables is approximately linear and where the model needs to be both efficient and easy to understand. Despite its simplicity, linear regression can be a powerful tool for forecasting and understanding relationships in data across a wide range of fields, including economics, healthcare, and social sciences. The Mathematical equation of Linear Regression is given below

Applications of Linear Regression:
Linear Regression has a wide array of applications across various fields due to its simplicity and interpretability. In economics, it is used to predict important economic indicators such as GDP, inflation rates, and stock prices by analyzing historical data and identifying trends. In the healthcare sector, Linear Regression models help in estimating disease progression, predicting patient outcomes, and assessing the impact of treatments based on patient demographics and medical history. In marketing, businesses leverage Linear Regression to forecast sales, understand customer behavior, and measure the effectiveness of marketing campaigns. Environmental scientists use Linear Regression to model climate change, analyze pollution levels, and predict the consumption of natural resources. Additionally, in social sciences, it aids in understanding relationships between variables such as income and education level, or employment rates and economic policies. Overall, Linear Regression's ability to provide clear, quantifiable insights makes it an invaluable tool in numerous fields requiring predictive analysis and decision-making.
2. Decision Trees
Decision Trees are versatile and intuitive machine learning algorithms used for both classification and regression tasks. They work by recursively splitting a dataset into subsets based on the values of input features, creating a tree-like model of decisions. Each internal node in the tree represents a decision based on a feature, each branch represents the outcome of that decision, and each leaf node represents a final prediction or classification. Decision Trees are prized for their simplicity and interpretability; the rules for decision-making are easy to follow and can be visualized graphically, making them accessible even to those without a deep understanding of machine learning. They can handle both numerical and categorical data, do not require feature scaling, and can model non-linear relationships. However, they can be prone to overfitting, especially when they grow too complex, and are sensitive to small changes in the data, which can lead to entirely different tree structures. Despite these limitations, Decision Trees remain a popular choice due to their ease of use and the insights they provide into the decision-making process. In Decision Trees, measuring uncertainty or the impurity of a node helps determine the best way to split the data to create a more informative and predictive model. Several metrics are commonly used to quantify this uncertainty, including:
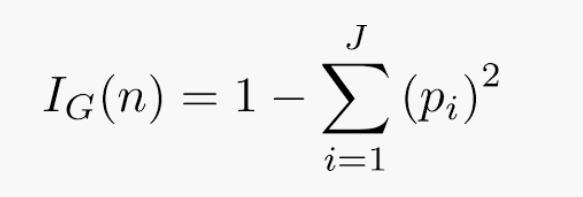
1. Gini Impurity
Gini Impurity measures the probability of a randomly chosen element being incorrectly classified if it were randomly labeled according to the distribution of labels in the node. Its formula is given by:
2. Entropy
Entropy, used in the ID3 and C4.5 algorithms, measures the amount of disorder or randomness in the data. It is based on the concept from information theory and is defined as:

3. Information Gain
Information Gain is derived from Entropy and measures the reduction in uncertainty or impurity achieved by partitioning the data based on a feature. It is defined as the difference between the entropy of the parent node and the weighted sum of the entropies of the child nodes:

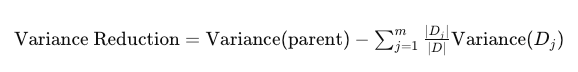
4. Variance Reduction
In regression tasks, where the target variable is continuous, variance reduction is used. It measures how the variance of the target variable decreases when a dataset is split based on a feature. The goal is to reduce variance in child nodes compared to the parent node, leading to more homogeneous target values in each split.
Applications of Decision Tree
Decision Trees are widely applied across various domains due to their versatility and ease of interpretation. In healthcare, they are used to diagnose diseases based on patient symptoms and medical history, helping clinicians make informed decisions about treatment options. In finance, Decision Trees assist in credit scoring and risk assessment by evaluating borrower profiles to predict default probabilities. In marketing, they are employed for customer segmentation and predicting purchasing behavior, enabling targeted campaigns and personalized recommendations. Additionally, Decision Trees are used in operations for quality control and fraud detection, as well as in environmental science for modeling ecological data and predicting environmental impacts. Their ability to handle both numerical and categorical data, coupled with their transparent decision-making process, makes them a valuable tool in these diverse applications.
3. k-Nearest Neighbors (k-NN)
k-Nearest Neighbors (k-NN) is a straightforward yet powerful machine learning algorithm used for both classification and regression tasks. It operates on the principle that similar data points are likely to be found close to each other in the feature space. When making a prediction, k-NN identifies the 'k' nearest data points to a new observation based on a distance metric, such as Euclidean distance. For classification, the algorithm assigns the most common class label among the nearest neighbors; for regression, it calculates the average of the target values of the nearest neighbors. One of the key advantages of k-NN is its simplicity and ease of implementation, as it makes no assumptions about the underlying data distribution. However, it can be computationally intensive for large datasets, as it requires distance calculations for each prediction, and its performance can be sensitive to the choice of 'k' and the distance metric used. Despite these limitations, k-NN remains a popular choice due to its intuitive approach and effectiveness in various practical applications, including recommendation systems, pattern recognition, and anomaly detection. Distance functions for knn are given below:

4. Support Vector Machines (SVM)
Support Vector Machines (SVMs) are powerful and versatile algorithms used primarily for classification tasks but can also handle regression problems. SVMs work by finding the hyperplane that best separates different classes in a high-dimensional space, aiming to maximize the margin between the hyperplane and the closest data points from each class, known as support vectors. This margin maximization helps ensure robust classification performance and generalization to unseen data. SVMs are particularly effective in high-dimensional spaces and with datasets where classes are not linearly separable, thanks to the kernel trick, which transforms the input data into a higher-dimensional space to find a linear separation. Despite their effectiveness, SVMs can be computationally intensive, especially with large datasets, and require careful tuning of hyperparameters to achieve optimal performance.
Applications for SVM
Support Vector Machines (SVMs) are widely used in various domains due to their robustness and effectiveness in handling complex classification and regression tasks. Here are some key applications:
SVMs are employed in natural language processing for tasks such as spam detection and sentiment analysis. They excel at categorizing documents based on the presence of keywords or phrases, making them valuable for organizing large text corpora.
In computer vision, SVMs are used for image classification and object recognition. They can differentiate between various objects in images by analyzing pixel patterns and features, aiding in applications like facial recognition and handwriting analysis.
SVMs assist in diagnosing diseases by analyzing patient data and medical records. They are used to classify medical images (e.g., MRI scans) or predict the likelihood of disease based on clinical features, enhancing diagnostic accuracy and early detection.
In finance, SVMs are used for predicting stock market trends, credit scoring, and fraud detection. Their ability to handle high-dimensional data and identify patterns helps in making informed investment decisions and detecting anomalous transactions.
SVMs play a role in gene classification and protein function prediction. By analyzing gene expression data and biological sequences, they help in understanding genetic diseases and protein interactions.
SVMs are used in speech recognition systems to classify spoken words or phonemes, enabling applications such as voice commands and transcription services.
These applications leverage the SVM’s ability to handle complex, high-dimensional data and provide accurate, reliable results in diverse fields.
5. Random Forest
Random Forest is an ensemble learning method that combines multiple decision trees to create a robust and accurate predictive model. It works by constructing a multitude of decision trees during training and aggregating their predictions to make a final decision. Each tree in the forest is trained on a random subset of the data with a random subset of features, which helps to ensure diversity among the trees and reduces the risk of overfitting. The final prediction is made through majority voting for classification tasks or averaging for regression tasks. Random Forests are highly effective for handling large datasets with numerous features, providing insights into feature importance, and managing both classification and regression problems. Their ability to generalize well and handle complex data structures makes them a popular choice in various applications, from financial modeling to medical diagnostics and beyond.
Applications for Random Forest
Random Forests are a powerful ensemble learning technique used in various domains for their robustness and versatility. Here are some key applications:
Random Forests are used to predict disease outcomes based on patient data, including clinical features, lab results, and imaging. They help in diagnosing conditions such as cancer, diabetes, and heart disease by analyzing complex patterns in the data.
In the financial sector, Random Forests are applied for credit scoring, fraud detection, and risk management. They analyze historical transaction data to identify patterns that indicate potential fraud or credit risk.
Random Forests help in customer segmentation, churn prediction, and personalized recommendations. By analyzing customer behavior and purchase history, they can segment customers into groups for targeted marketing strategies.
In environmental science, Random Forests are used for modeling and predicting environmental changes, such as deforestation, pollution levels, and climate impacts. They handle large datasets and complex interactions between environmental variables.
Random Forests are employed in computer vision tasks such as image classification and object detection. They analyze pixel features and patterns to classify images into categories or identify objects within images.
In agriculture, Random Forests are used for crop prediction, soil quality assessment, and pest detection. They analyze various agricultural factors to improve crop yield and manage resources effectively.
Random Forests are applied in text classification tasks such as sentiment analysis, spam detection, and topic modeling. They analyze text data and extract features to categorize documents or messages.
In conclusion, these top five machine learning algorithms—Linear Regression, Decision Trees, k-Nearest Neighbors, Support Vector Machines, and Random Forest—cover a broad spectrum of tasks and offer unique strengths and capabilities. While some, like Linear Regression and k-NN, are easy to understand and implement, others like SVM and Random Forest provide more sophisticated methods for handling complex data. Understanding these algorithms and knowing when to apply them is crucial for solving real-world problems efficiently. As you explore these methods, remember that the choice of algorithm depends on the specific problem, the nature of the data, and the computational resources available. Happy learning and experimenting!
Comments